The 2025 year was most heavily influenced by turbulent market conditions related to inflation and federal policy changes including government staffing cuts, imposition of tariffs and restrictions in immigration. These factors caused a lot of market uncertainty; like 9/11, the 2009 recession and the COVID pandemic, there is invariably a temporary slowdown in travel. While it may be a more discretionary expenditure for both leisure and corporate travel purposes, on a positive note, travel is also an evergreen industry and least likely to be replaced by virtual experiences (as we have seen in retail and other sectors).
Another major challenge hotels faced in 2025 was a rapid rise in major expenses that coincided with a period of decelerating demand. Inflation, coupled with high interest rates and increases in hotel operating costs such as labor, customer acquisition costs and utilities along with insurance and tax spikes are leading hotels to evaluate and in some cases, re-imagine how they fill and operate hotels.
In reviewing U.S. hotel performance in 2025 compared to previous periods, it’s notable that demand has still not yet returned to pre-pandemic levels and the uncertainty of 2025 led to a few steps backward on this path. Rates, on the other hand, although not growing at the same rate as they did in the early stages of recovery, continue modest growth.
U.S. RevPAR growth by month 2019, 2023, 2024, 2025

Occupancy and ADR trends by month in 2025

Surprising and sustained changes by day of week 2023, 2024, 2025
Likely due to the sustained work-from-home changes in many offices, the once hard-to-fill Thursday and Sunday nights have become much stronger. Monday through Wednesday is still softer than it was pre-pandemic due to reduced corporate travel but there is still an opportunity for those days to improve as the economy grows.

Leisure exceeds commercial contribution to RevPAR post-pandemic
Also, a shift from traditional commercial dominance to leisure in hotel demand has reinforced weekends as a source of stability for hotels.

By hotel type: Luxury and extended-stay hotels—the winners of 2025
Even with slight improvement in rate, with the disappointing demand, RevPAR growth landed just below 2024 levels. By hotel type, there were some differences with luxury hotels ending the year with a +1% growth rate and the extended stay segment demonstrating the strongest demand growth of all hotel types at +2%.

Finding a hotel’s most profitable mix by channel
Given the industry imperative to focus on profit, it is increasingly critical to find the areas that can be managed when even a few points of improvement can yield hundreds of thousands in asset value growth. In examining the composition of RevPAR across the U.S. hotels, several themes emerge which are positive signs for an industry in transition.
For example, the cost to acquire a hotel’s customers is running 20-30% of guest-paid revenue and is second only to labor in overall cost to a hotel (labor cost is 30-35% of revenue). Understanding and managing business mix is the primary lever in a hotel’s ability to reduce these costs.
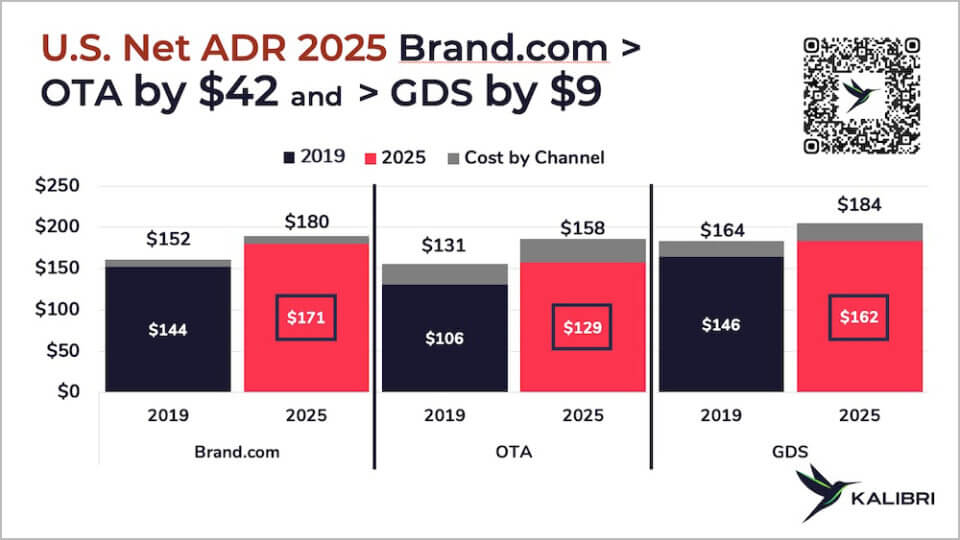
*net of commissions, channel fees, loyalty costs
Loyalty contribution and Brand.com demand share
Drilling deeper into the loyalty programs, the contribution of loyalty members in branded hotels has grown to 57% of all room nights and been a tailwind for the growth of Brand.com which has surpassed 25% of total demand. While the loyalty member rate business is the fastest growing, when accounting for all discounts and loyalty fees, this business, largely booked through Brand.com is still considerably more profitable than third party business.

2026 forecast
As of January 14, 2026, Kalibri is forecasting RevPAR growth for 2026 to be -1%. Given the degree of turbulence sustained over the last year, it is unlikely it will stop entirely and market conditions may still shift in ways that cause both positive and negative outcomes.
Favorable factors include declining interest rates, pauses on tariffs and relatively good market fundamentals such as employment and GDP growth. The strong stock market may help change the wait-and-see behavior of many businesses that slowed corporate travel and group activity. There is also an expectation of some major events having positive effects on industry performance, albeit in select markets such as America’s 250th and the World Cup with participation across many different markets.
On the negative front, the unpredictable nature of federal policy changes may continue to disrupt a return to a stable travel economy. Geopolitical uncertainty poses the potential risk of increases in global energy costs and added friction to the supply chain, unknown effects on inflation, along with putting a damper on U.S. inbound international travel growth.
Forecasting a range makes more sense with so much uncertainty; Kalibri has put the 2026 YoY RevPAR forecast between -1.5% and +1%. While circumstances may prove to be more positive as the year unfolds, planning on flat results with the possibility of further declines may prove to be a prudent path.
Profit first
Once again, given the sharp increase the industry has sustained in key expenses alongside muted demand, many hotels are re-imagining the approach to the way hotels are filled and operated. Status quo may have to replaced with creative re-thinking of how to acquire revenue and how to manage the operation that results in the highest profit contribution possible.