NATIONAL REPORT—Since January, CBRE Hotels Research has been analyzing the impact of the novel coronavirus to understand how the societal and economic impacts of COVID-19 will influence the performance of U.S. hotels.
Initial guidance came in the form of updated Hotel Horizons forecasts of occupancy, ADR and RevPAR for the nation’s chain scales, location categories and 60 major markets. Concurrently, CBRE relied on the historical relationship between declines in RevPAR to estimate the potential decreases in profits. For example, a 20% decline in RevPAR for a full-service hotel during 2009 resulted, on average, in a 39% decline in gross operating profits (GOP) and a 52% drop in earnings before interest, taxes, depreciation and amortization (EBITDA).
As the forecast updates have progressed, the magnitude of the projected declines in RevPAR have surpassed anything the firm has seen while tracking U.S. hotel performance the past 90 years. As of April 12, CBRE Hotels Research is forecasting an annual decline in RevPAR of 46.0% across all U.S. hotels in 2020. Based on CBRE’s annual “Trends in the Hotel Industry” survey of U.S. hotel operating statements, the previous greatest annual decline in RevPAR occurred in 1932 when the Trends sample suffered a RevPAR decrease of 24.7%.
Low Occupancy Levels
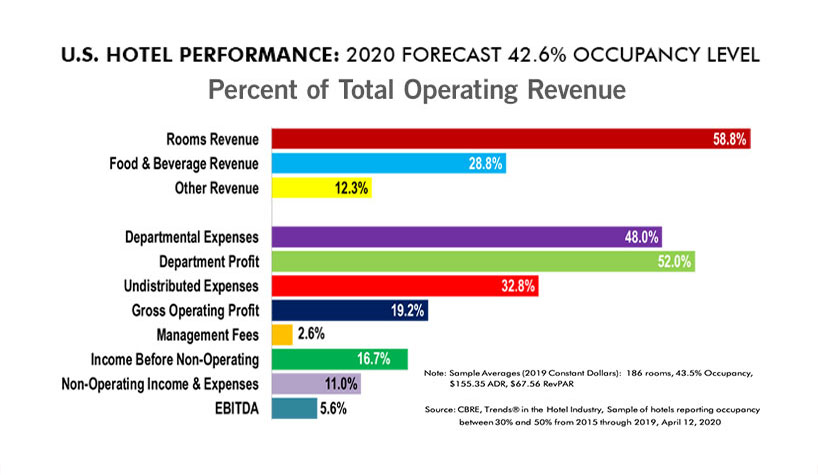
With the lack of RevPAR declines to use as a precedent, CBRE’s efforts to provide guidance on the potential profitability of U.S. hotels in 2020 have shifted toward an analysis of operating performance at the low levels of forecast occupancy. Based on CBRE’s April 12 forecast, the U.S. lodging industry is projected to achieve an annual occupancy level of 42.6% this year. To put this in perspective, the lowest annual occupancy level ever achieved by the CBRE Trends sample was 44.5% in 1933.
Analyzing hotel operating performance based on occupancy levels inherently considers the fixed/variable nature of hotel expenses. At the low levels of occupancy currently forecast for 2020, hotel owners and operators have responded by reducing their fixed costs as much as they can and spending just a minimal amount on the variable costs.
CBRE presented select revenue, expense and profit ratios as a percent of total operating revenue for each of the six chain-scale categories. The data is based on the aggregate performance of hotels that achieved an occupancy level proximate to the April 12 forecasts for each respective chain scale. The data was derived from samples of operating statements for the years 2015 through 2019, adjusted to constant value 2019 dollars.
- Luxury: CBRE forecasted a 39.3% occupancy level, with room revenue at 63.4%, F&B revenue at 28.3% and other revenue at 8.4%. GOP was forecasted at 17.8%, while EBITDA was -2%.
- Upper-Upscale: Occupancy at 37.5%; room revenue at 55.4%; F&B revenue at 36.6%; other revenue at 8%; GOP at 9.2%; and EBITDA at -4.2%
- Upscale: Occupancy at 43.8%; room revenue at 64.8%; F&B revenue at 28.2% other revenue at 7%; GOP at 14.2%; and EBITDA at 3.6%
- Upper-Midscale: Occupancy at 46.5%; room revenue at 79.5%; F&B revenue at 17.7%; other revenue at 2.8%; GOP at 22.1%; and EBITDA at 11.7%
- Midscale: Occupancy at 41.7%; room revenue at 81%; F&B revenue at 15.6%; other revenue at 3.4%; GOP at 8.6%; and EBITDA at -4.4%
- Economy: Occupancy at 47.1%; room revenue at 98%; F&B revenue at 0.6% other revenue at 1.4%; GOP at 33.1%; and EBITDA 22.7%
As expected, there is a correlation between the occupancy level and the achieved profit margins. The lower the occupancy level, the lower the GOP and EBITDA margins. Properties in all six chain-scale categories were able to realize a positive GOP at their respective forecast annual occupancy levels. However, only those in the upscale, upper-midscale and economy segments were able to earn a positive EBITDA, albeit minimal in most cases.
It is acknowledged that analyzing the performance of hotels that have historically operated at low occupancy levels has its drawbacks. For example, seasonal resorts routinely operate at low occupancy levels on an annual basis but have the expectation of fluctuating revenues throughout the year and can adjust their expenses accordingly.
Think Annually
Occupancy levels are forecast to bottom out at 23.3% during the second quarter of 2020. Reviewing the CBRE database of operating statements, it is virtually impossible for a hotel to generate a gross operating profit, let alone any EBITDA, at such a low level of occupancy. Therefore, several hotel owners have shuttered operations in March and April, with the expectation to reopen later in the year.
For hotels that can sustain operations (albeit at times at minimum levels) for the entire year and achieve an annual occupancy level near CBRE’s current forecast of 42.6%, the possibility does exist for most hotels to generate a sufficient cash flow to cover a property’s departmental and undistributed operating expenses. The ability to achieve cash flow at the EBITDA level, and therefore pay debt-service or distribute a return on investment, is doubtful.
Unique Costs of Reopening
In 2020, those hotels that opt to close for a portion of the year may mathematically achieve relatively modest “annual” levels of occupancy and have limited the negative cash flows that would have occurred during the depths of the second quarter. However, when these properties reopen as anticipated during the third or fourth quarters, they will undoubtedly incur unique cleaning, maintenance, rehiring, inventory and other operating expenses that do not typically influence the financial performance of a hotel.
The ability to generate an “operating profit” is of limited benefit to hotel owners, lenders and investors that depend on EBITDA profits. However, an understanding of operating performance at austere levels does provide guidance to potential cash flows that can inform negotiations and discussions among the various stakeholders in hotel real estate investment and operations.